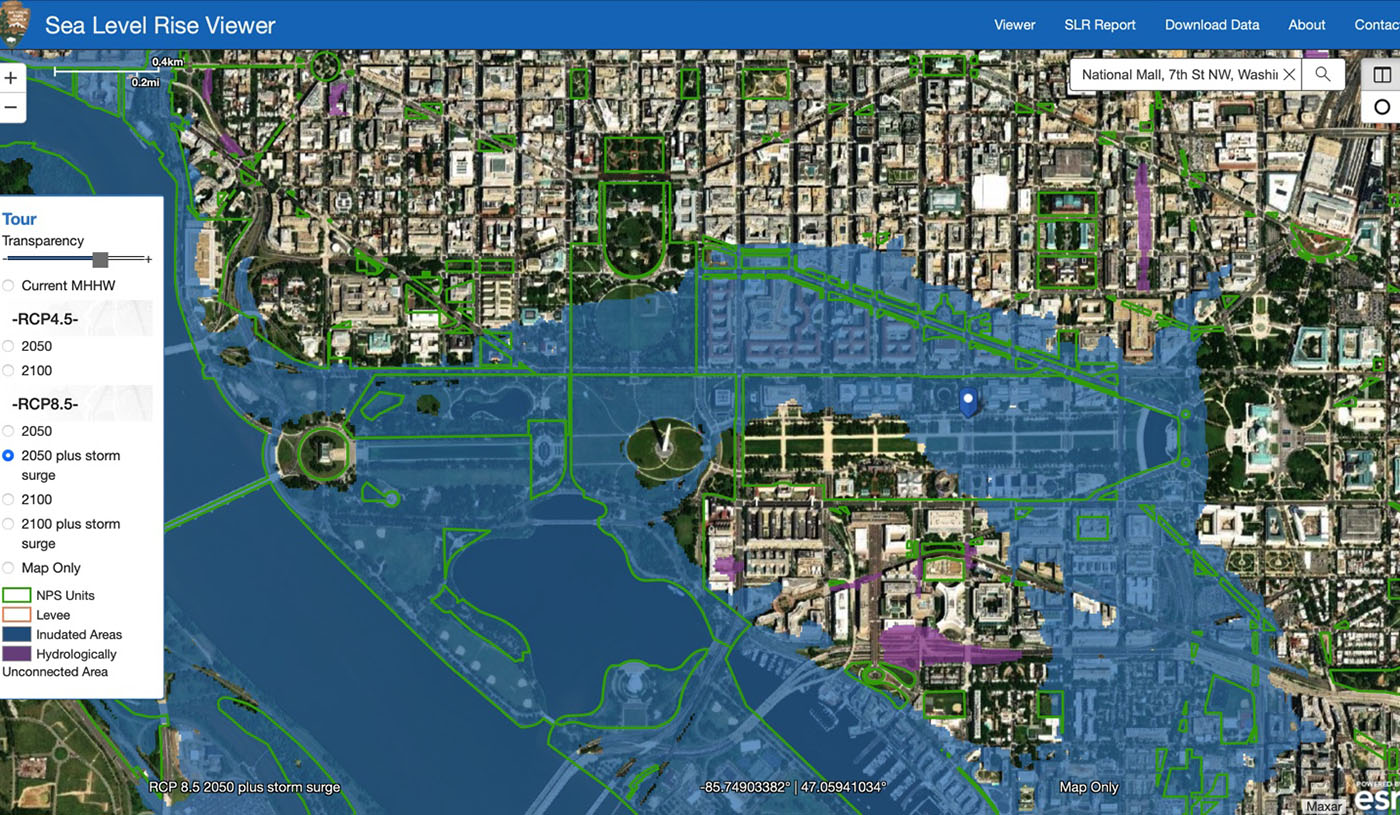
In 2018, the National Park Service released a report that analyzed the effects of climate change on flooding in our national parks. The report show that the threat to the National Mall is catastrophic. The map below, from “U.S. National Park Service, Sea Level Rise Viewer” (2019), shows, in blue, projected sea level rise by the year 2050 plus storm surge.*
In this eight-question quiz, consult the map to see if you can evaluate the scope of the flooding threat to our Smithsonian museums and national monuments.
Click here if you need a Mall map to identify individual museums and public buildings.
*This map is no longer accessible online; an updated (2022) Sea Level Rise Viewer can be found at NOAA. According to NPS, the RCP8.5 scenario (selected in the legend on the map) “represents a moderate amount of anthropogenic climate forcing that would raise global temperature anomalies by an average 4.9˚ C. Storm surge, according to the National Oceanic and Atmospheric Administration, is the abnormal rise in seawater level during a storm, measured as the height of the water above the normal predicted astronomical tide. The surge is caused primarily by a storm’s winds pushing water onshore.
Click on map to enlarge
At the end of the quiz, click the blue check mark to see your score.
Tags: Flooding, National Mall, quiz